
A line graph is the best way to display the information and observe the trends. Let’s understand line graphs in more detail, which will make it easier for you to learn how to make a line graph in Google Sheets. Before we start, let’s understand what a line graph in Google Sheets is.
So, in a simple way, line graphs are a way to record and monitor informational changes accurately. A line graph is also known as a line chart. Line graphs have straight lines which connect data points called ‘markers’. Line graphs have horizontal and vertical axes, which differentiate between categories and measurement values.
Table of Content
| How to Make a Line Graph in Google Sheets? What are the Important Parts of a Line Graph? Why Should You Use Line Graph? How to Make a Line Graph in Google Sheets? How to Make a Line Graph in Google Sheets – Line Graph How to Make a Line Graph in Google Sheets – Multiple Lines How Many Types of Line Graphs are in Google Sheets? Conclusion |
What are the Important Parts of a Line Graph?
So, first of all, we have to understand the different parts of a line graph. Understanding this can easily help display and analyze the information. So, let’s learn some important terminologies in line graphs before diving into how to make a line graph –
- X-Axis (Horizontal axis)
- Y-Axis (vertical axis)
- Chart title
- Markers
- Grid
- Y-Axis label
- X-Axis label
- Legend
Why Should You Use Line Graph?
The line graph helps serve the following purpose –
- Showing data
- Easy to understand, indicate, and read.
- Easily displaying changes over time.
- Understanding trends in the datasheet.
- Showing how two variables relate to each other.
So, you can make a line graph when you need to explain trends, changes, increases, decreases, etc. Let’s dive in and learn how to make line graphs in Google Sheets.
How to Make a Line Graph in Google Sheets?
Line graphs are easy to make. All you need to know is where you find the charts and graphs in Google Sheets. Here’s how you can create a line graph.
- Enter data in Google Sheets.
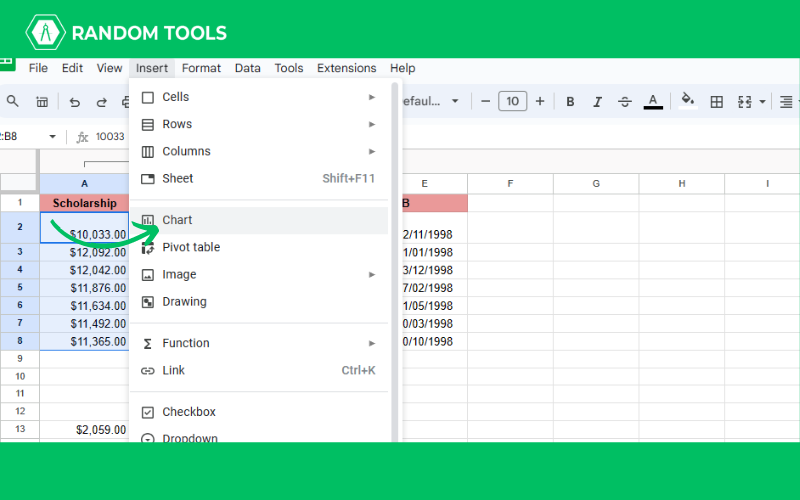
- Select the data and go to the toolbar.
- Go to Insert>Chart.
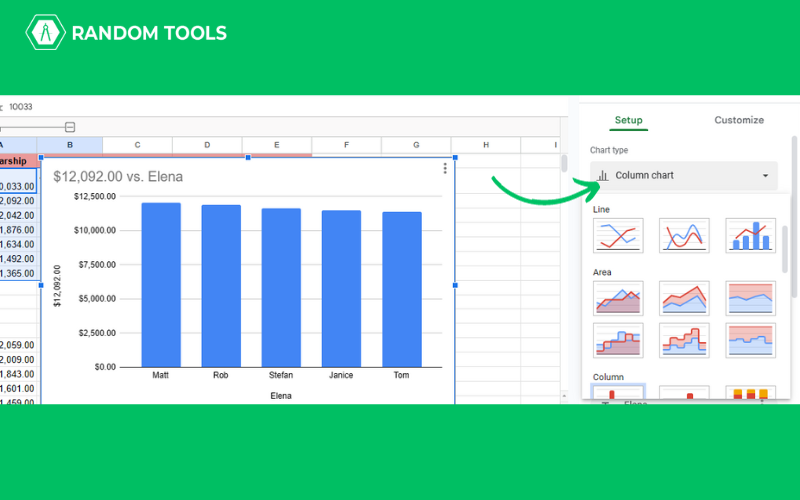
- You will find several chart options on a page on the screen, such as Smooth Line Chart, Regular Line Chart, and Combo Line Chart.
- Ensure the correct ranges are entered in the X-axis and Series sections.
- You can also customize the data and the chart as per your liking.
How to Make a Line Graph in Google Sheets – Line Graph
After choosing your Line Chart, you can further customize the graph. Here’s how to do it –
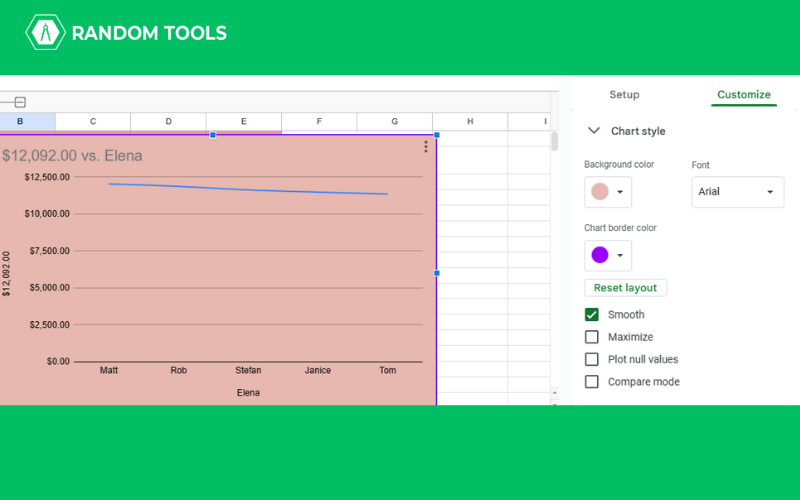
- Click on Customize beside the Setup option.
- Go to Chart Style.
- Click on the Background Color.
- Choose the font type and customize other parameters, as shown below.
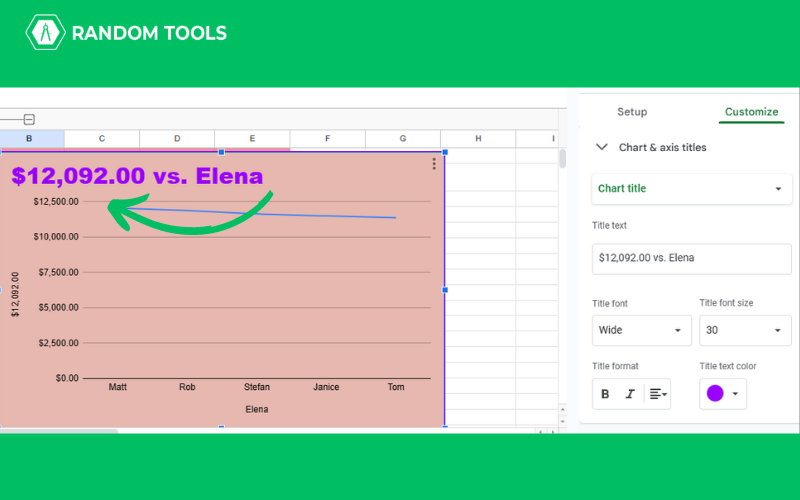
Now, you can also change the title font and size of the chart title. Here’s how to do it –
- Explore the Chart Axis Title, choose Chart Title in the drop-down list at the top.
- Once selected, enter the chart title in the text box.
- Click the Bold icon in Title Format and select blue in Title Text Color, as shown below.
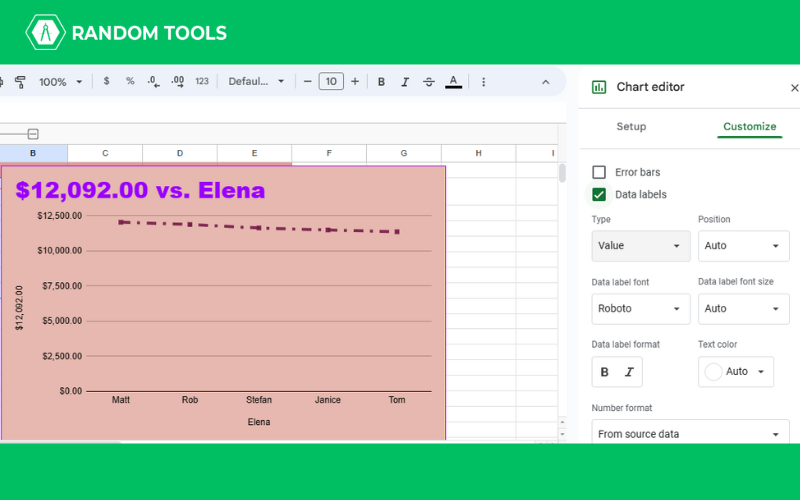
You can also change the line color and opacity by following the steps given below –
- Go to the Series tab.
- Change Line Color to blue and choose 7px for Point Size and Circle for Point Shape.

- You can also add labels by checking the box near Data Labels.
- Then, go to Legend and add a position at the Bottom, Middle, or Top.
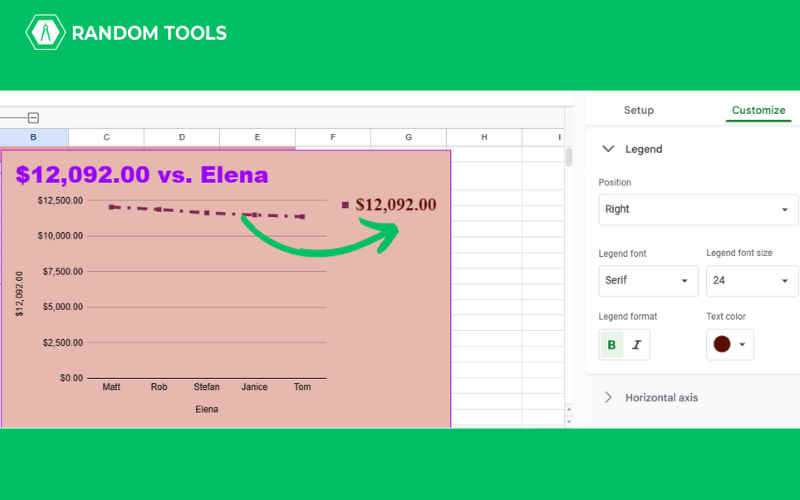
- Also, you can change the degree or the graph by hovering over the Horizontal Axis and changing the Slant Labels.

- Input minimum and maximum values in the Y-axis in the text box.
How to Make a Line Graph in Google Sheets – Multiple Lines
Now that you know how to create and customize a single line graph, it is time to understand how to make a line graph in Google Sheets using multiple items. This helps show different values.
- Select the data you want to include in the case.
- Go to Insert>Chart.
- You will have a few lines on the sheets, as shown below.

- You can add or remove the line series from Setup>Chart Editor.
- You can edit or customize the chart from Customize.
How Many Types of Line Graphs are in Google Sheets?
As per Google Sheets, there are three line graphs – Smooth Line Chart, Line Chart, and Combo Chart. We have already told you how to make a line graph in Google Sheets. Let’s learn how to make Smooth Line and Combo Charts in Google Sheets.
Smooth Line Chart
In line graphs, you will find rough edges; on the other hand, smooth line graphs don’t have any edges. Smooth line graphs are particularly used for small data sets, where distortions can be avoided. Here’s how to make a smooth line graph –
- Select the data input in the Google Sheets.
- Go to Insert>Chart.
- You will have a basic line chart on your Google Sheets.
- From the Chart Editor, go to the Setup tab.
- Go to Chart Type and change the selection to Smooth Line Chart, as shown below.

Combo Chart
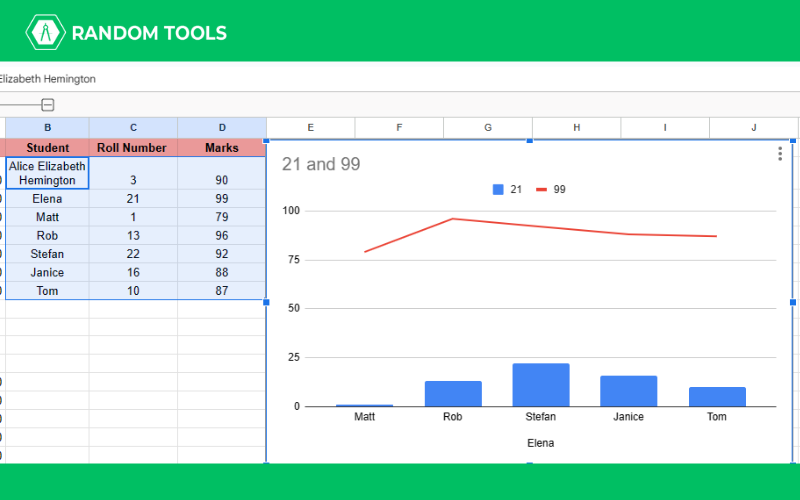
Here’s how you can make a combo chart –
- Select the data set.
- Go to Insert>Chart.
- From the Chart Type dropdown, select the Combo Chart.
- The bar graph shows the roll number, and the marks are in the red line, as shown below.
Conclusion
As you have seen, learning how to make a line graph in Google Sheets is not very tough. You need a basic understanding of what a graph is (most importantly, what a line graph is) and where you can find them in Google Sheets. Once you understand the basics, you are good to go. Hence, you can create a line graph of your own and be a workplace superstar!
Line graphs are a great way to display the change in variables. Now you know how to make a line graph in Google Sheets, the types of line graphs, and the use of the graphs in Google Sheets. In addition, you know the difference between the three types of charts shown on Google Sheets: Smooth Line Chart, Line Chart, and Combo Line Chart.