
The pie chart is an effective tool for displaying data. Pie charts are a fantastic way to see how much each category makes up the overall total. You could, for instance, display the percentage of the total budget that each line item in your budget represents. Doughnut charts, pie charts, and 3D pie charts can all be made in Google Sheets. Also, all the visuals and content in pie charts are customizable.
You will discover in this article how to make a pie chart in Google Sheets. Additionally, you’ll learn how to customize your pie charts’ contents and presentation that match your requirements by showing percentages, adding labels, or converting them into doughnut charts or 3D pie charts.
So, without wasting any time, let’s dive into learning how to make a pie chart in Google Sheets.
Table of Content
| How to Make a Pie Chart in Google Sheets? How to Make a Pie Chart in Google Sheets – Customize a Pie Chart How to Make a Pie Chart in Google Sheets – Doughnut Chart How to Make a Pie Chart in Google Sheets – With Percentages How to Make a Pie Chart in Google Sheets – With Labels How to Make a Pie Chart in Google Sheets – Edit Pie Conclusion |
How to Make a Pie Chart in Google Sheets?
First, let us create a simple pie chart depending on the input in the sheet. Here’s how to make a pie chart in Google Sheets –
- Open Google Sheets and fill in the necessary data.
- Select the data.
- Go to Insert, and select Chart.
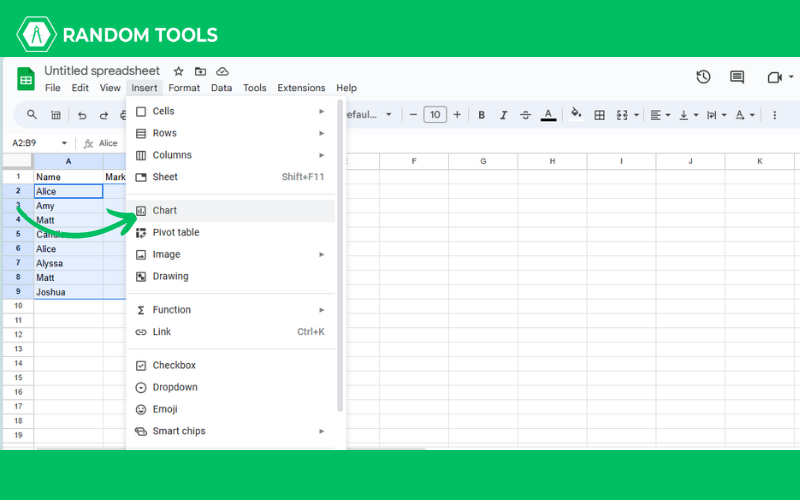
- Go to the Column Chart.
- Go to the pie chart and select your pie chart.
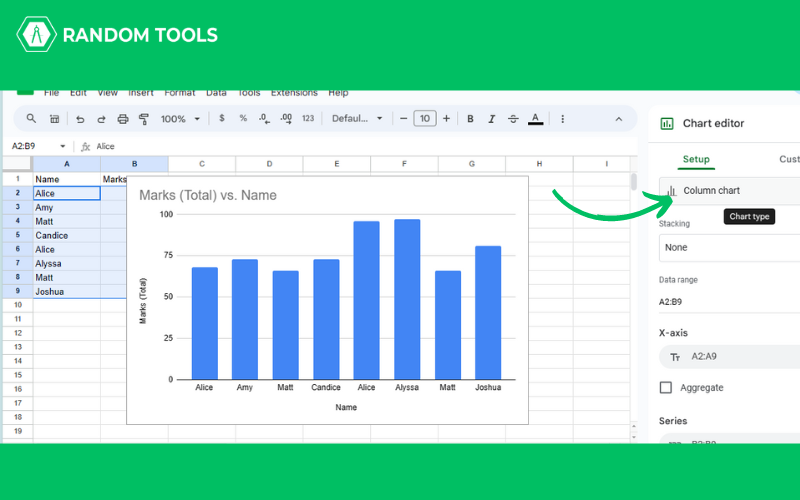
- There you go! You have a pie chart.

Google Sheets automatically recognizes the data and displays a pie chart with the data.
How to Make a Pie Chart in Google Sheets – Customize a Pie Chart
Now you know how to make a pie chart in Google Sheets, let us customize it. You can customize a pie chart depending on your needs and preferences. Here’s a tutorial on how you can turn your simple and boring pie chart into a 3D pie chart –
- Double click on the pie chart to open the chart editor.
- From the chart editor, click on the Customize option.
- Click on Chart Style.

- Check mark on the 3D option.
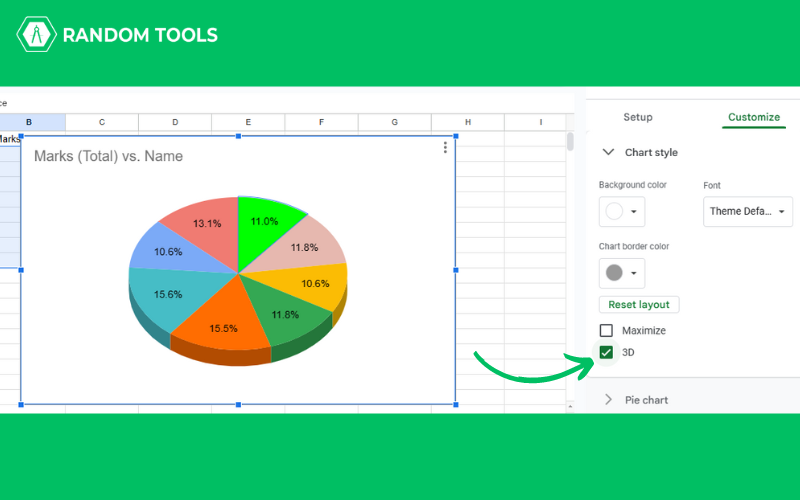
You have your 3D pie chart ready! You can also do it from Chart Type>Setup option.
How to Make a Pie Chart in Google Sheets – Doughnut Chart
There are several ways to customize the pie chart, and another way to customize is by making it into a doughnut. See how you can do it –
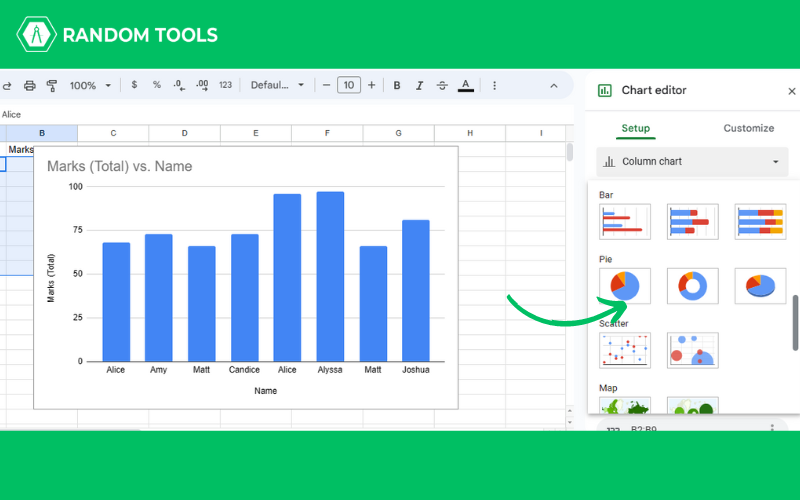
- Double click on the pie chart to open the chart editor.
- From the chart editor, click on the Setup option.
- Click on Chart Type.
- Scroll down to the Pie area. There, you will see a doughnut chart.

- That’s it! You have a doughnut chart ready.

How to Make a Pie Chart in Google Sheets – With Percentages
As you know, Google Sheets automatically adds labels with the category name and the percentages. However, you might want to show the percentages in the particular slices of the chart. Here’s how you can do that –
- Double click on the pie chart to open the chart editor.
- From the chart editor, click on the Customize option.
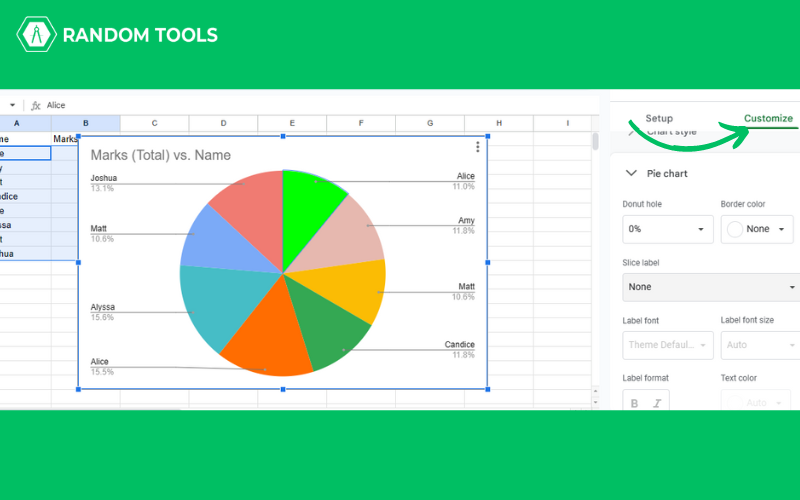
- Click on the Pie Chart.
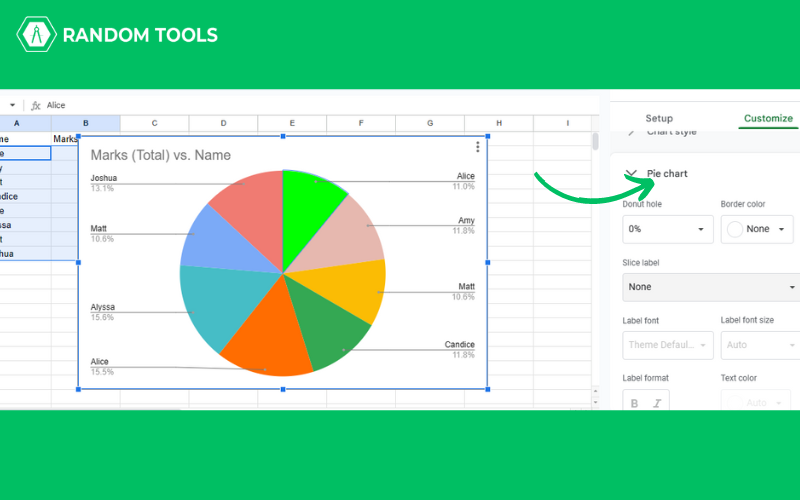
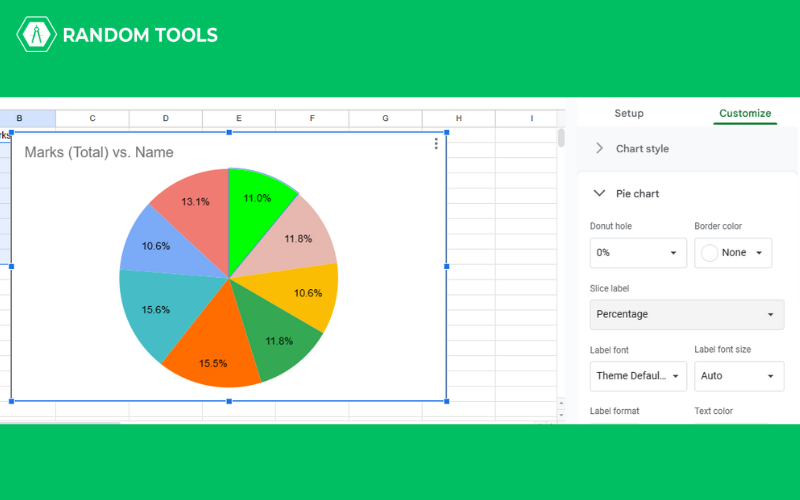
- Click on the dropdown menu under Slice Label>Percentage.

- Now you have a pie with a percentage shown within it.
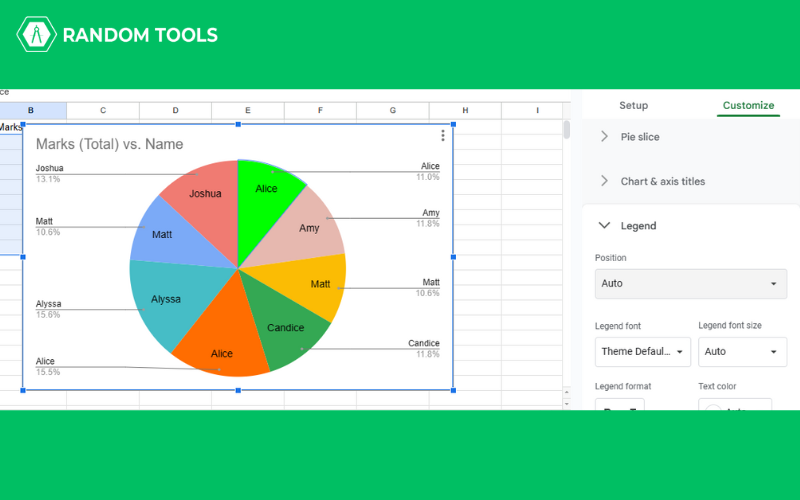
- Under Customize, you will find a dropdown with Legend.
- Click the dropdown menu under Position, and click any one of you want.
- There you have it! You have a pie chart to identify the different categories.
How to Make a Pie Chart in Google Sheets – With Labels
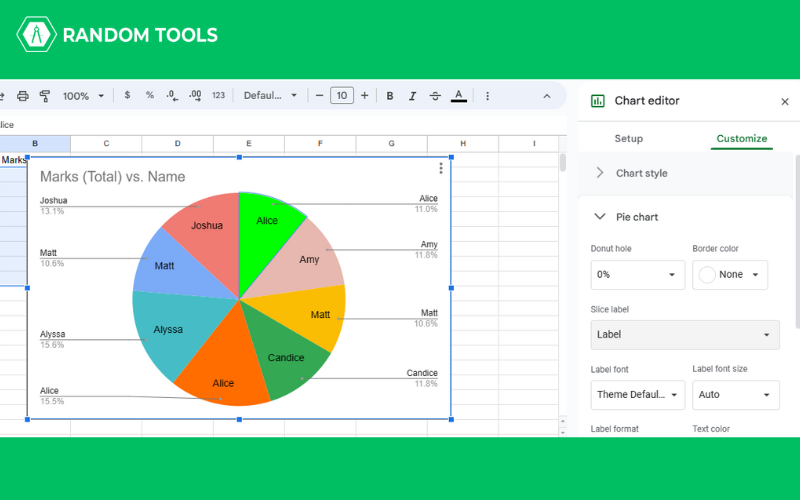
If you do not wish to show any value or percentage, you can make a pie chart with labels only. Here’s how you can do it –
- Double click on the pie chart to open the chart editor.
- From the chart editor, click on the Customize option.
- Click on the Pie Chart.
- Click the dropdown option in the Slice Label, and then select Label.

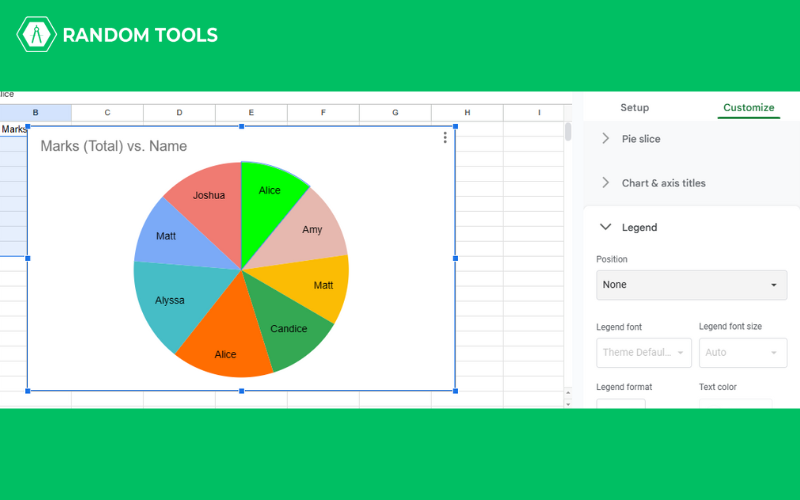
- Now you have your pie chart ready with labels only.
Also, if you want to remove the legend –
- Click Legend in the dialog box at the side to expand the options.
- Click the dropdown under Position>None.
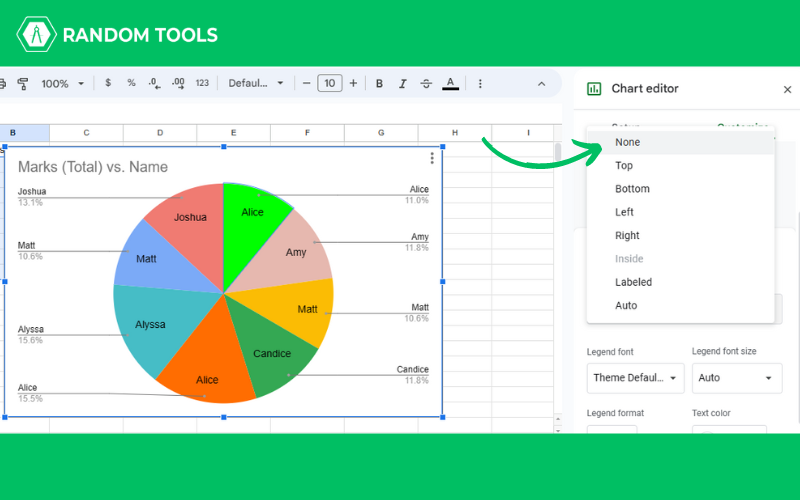
- There you go! The legend is not there anymore.
How to Make a Pie Chart in Google Sheets – Edit Pie
Now that you know how to make a pie chart, editing it is easy. Here’s how you can do it –
Change the Chart Type
Here’s how to change the chart type –
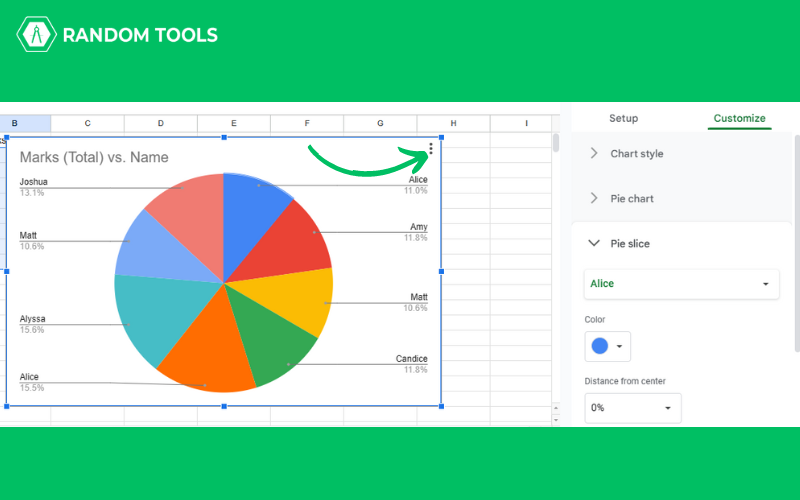
- Select the pie chart, and you’ll find three vertical dots in the top-right corner of the pie chart.

- Under the chart style, you can edit the border and background of the pie chart.
Change the Data Range
Here’s how you can change the range of your data –
- Right Click on the chart and select Data Range from the menu.
- You can modify the data range by clicking the small box, as shown below.
- Select Edit Chart.
- Under the Chart Style, in the Customize section, you can choose the border and background, as well as the font.
- Here, you can also Maximize or Minimize the space used by the pie chart.
Conclusion
As you can see, pie charts show the distribution of components as a whole. They are, therefore, the best tools to utilize when working with a limited set of categories or values. Having too many categories, meanwhile, can make it aesthetically disorienting. In other words, the pie will have so many slices that it will be challenging to read and comprehend.
You know how to make am easy pie chart in Google Sheets. You also understand how to create a basic Google Sheets doughnut chart, a 3D pie chart, how to show percentages, and how to add labels. Additionally, you are familiar with adjusting a pie chart to alter the layout or the data range.